Search and commands everywhere
Built for the Saudi market
The market.Made clearer.
One complete analysis workspace combining charts, scanners, maps, backtesting and a trading journal—designed for macOS.
One system. Unbroken context.
You don't need more data. You need to see what it means.
Charterji connects the market to the stock, the stock to an idea, the idea to a test, and the test to a documented decision you can review.
01 — Market discovery
Start with the whole market. Then move closer.
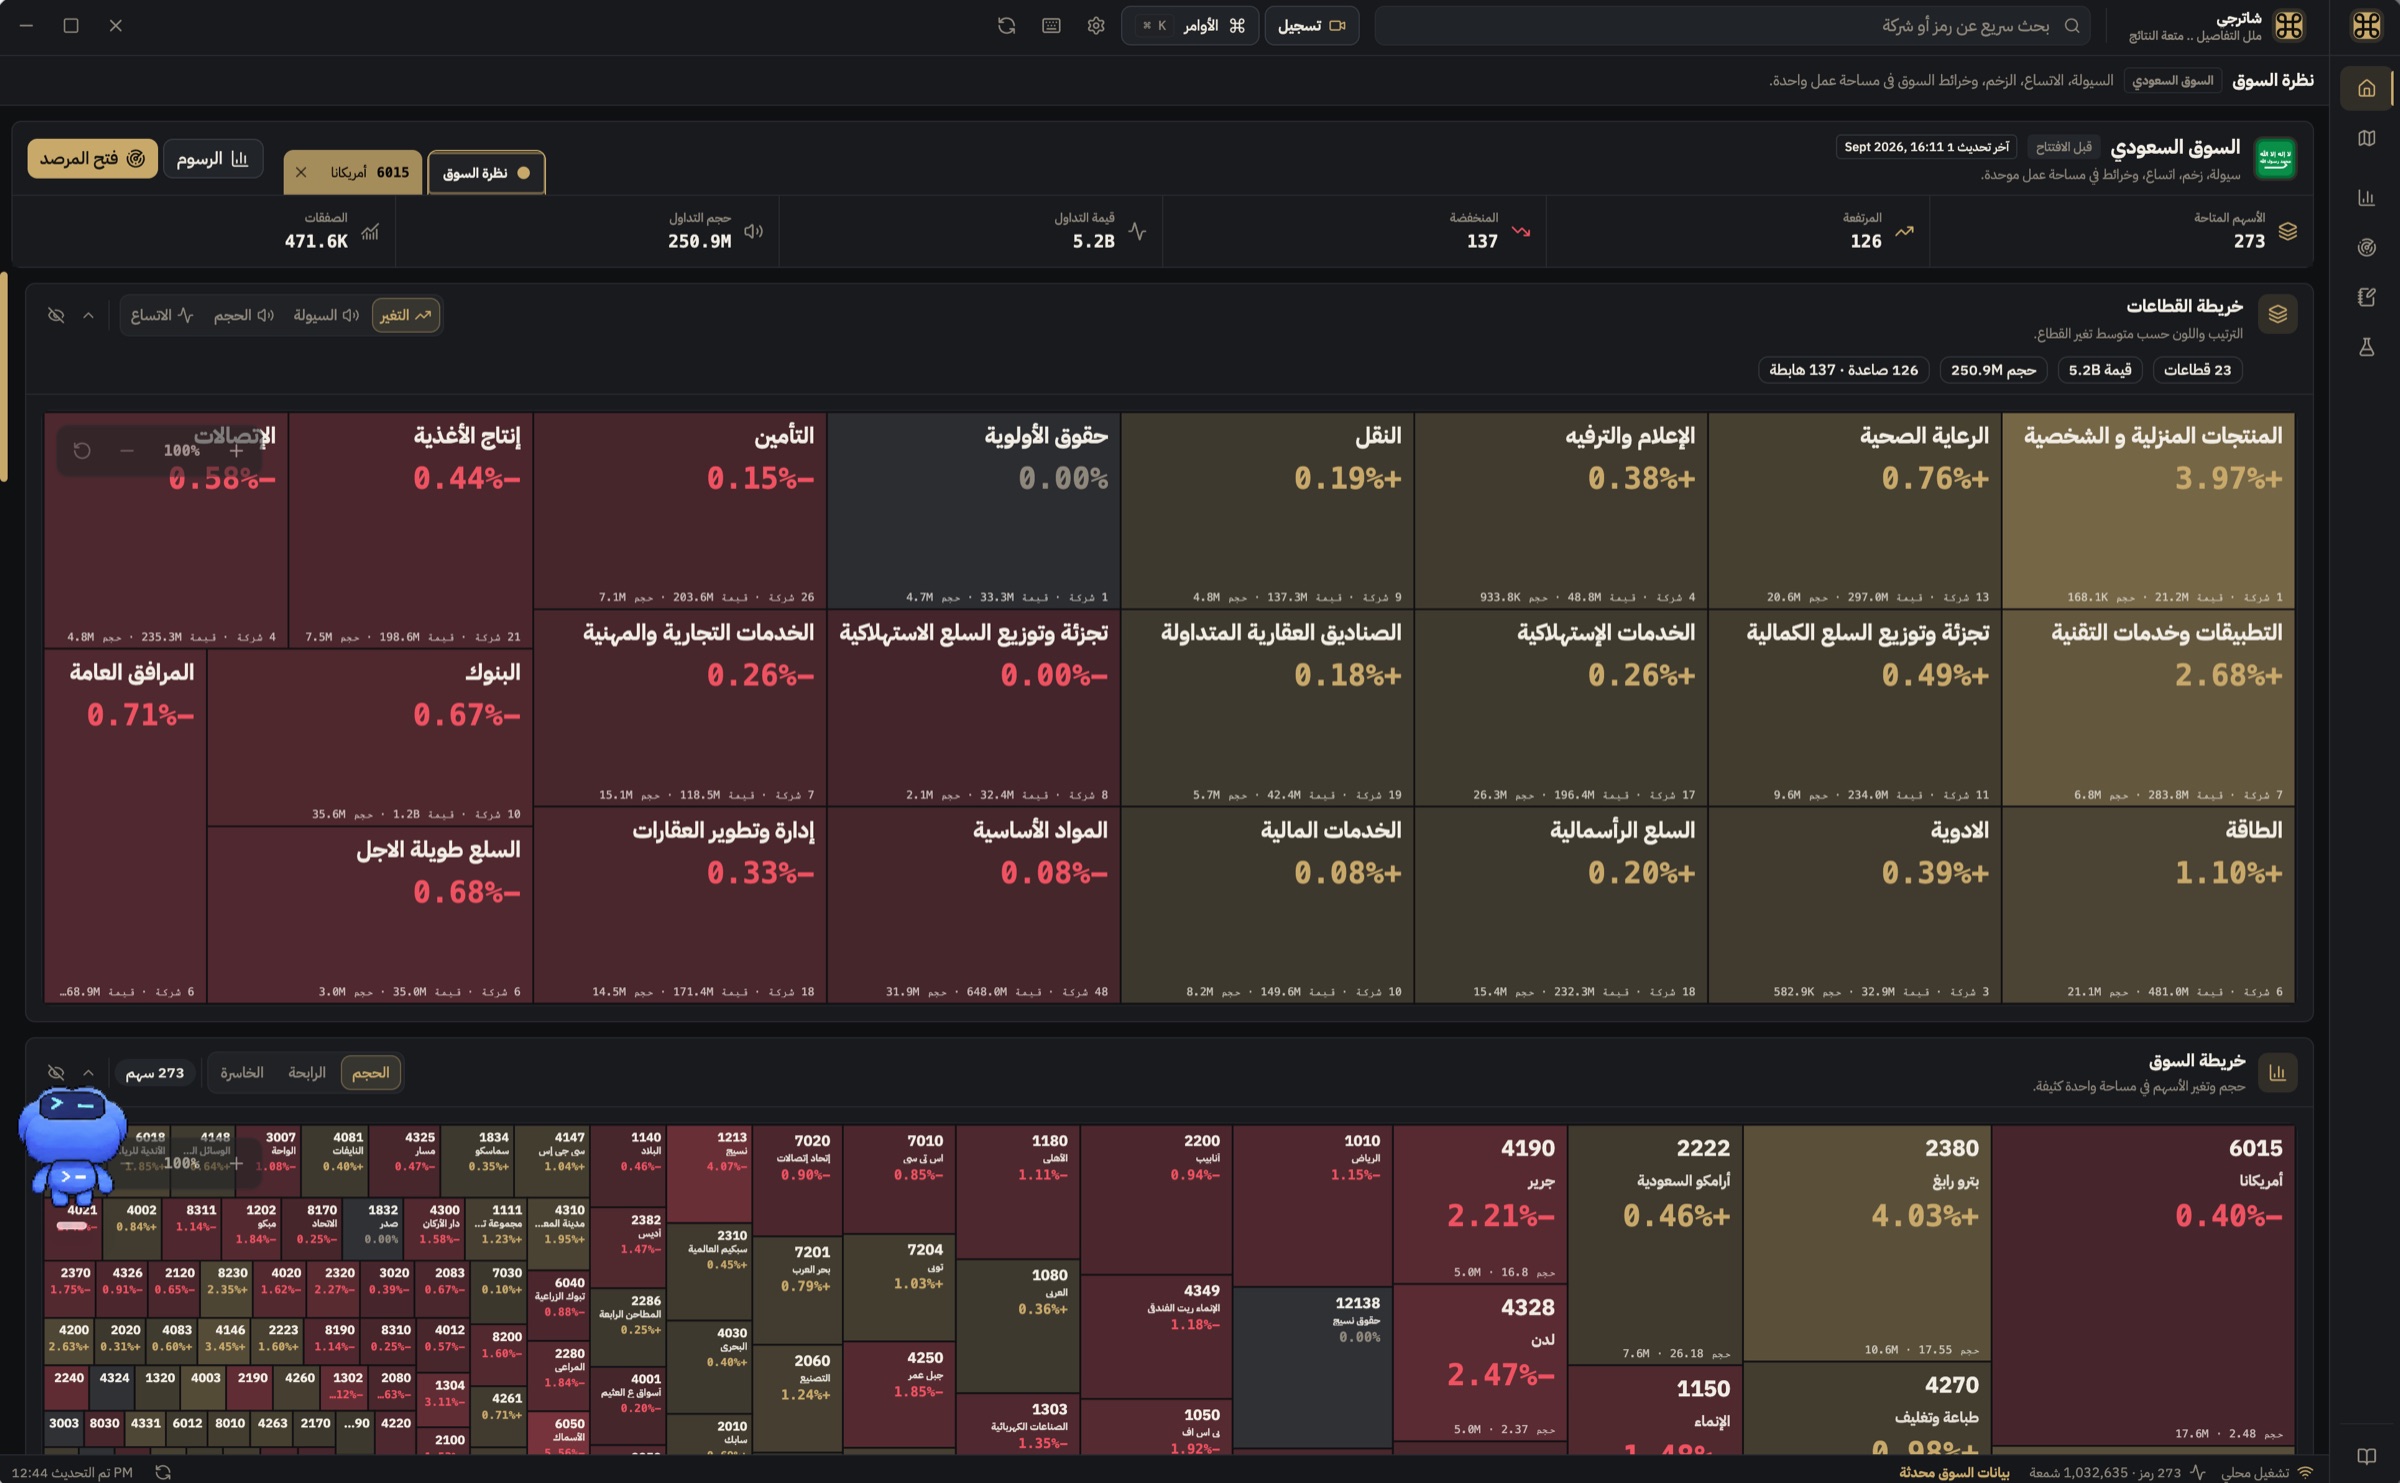
See direction, liquidity, breadth and activity at once. Sector and equity maps reveal where strength is moving before you open a chart.
- A live view across 273 equities
- Maps by change, volume, liquidity and profitability
- Breadth, highs, lows and gaps
02 — Technical pattern finder
Let the market tell you where to look.
Scan the market for chart patterns, candlesticks, breakouts and trend lines, then move straight from a result to the full chart.
From 273 equities to a list worth your time.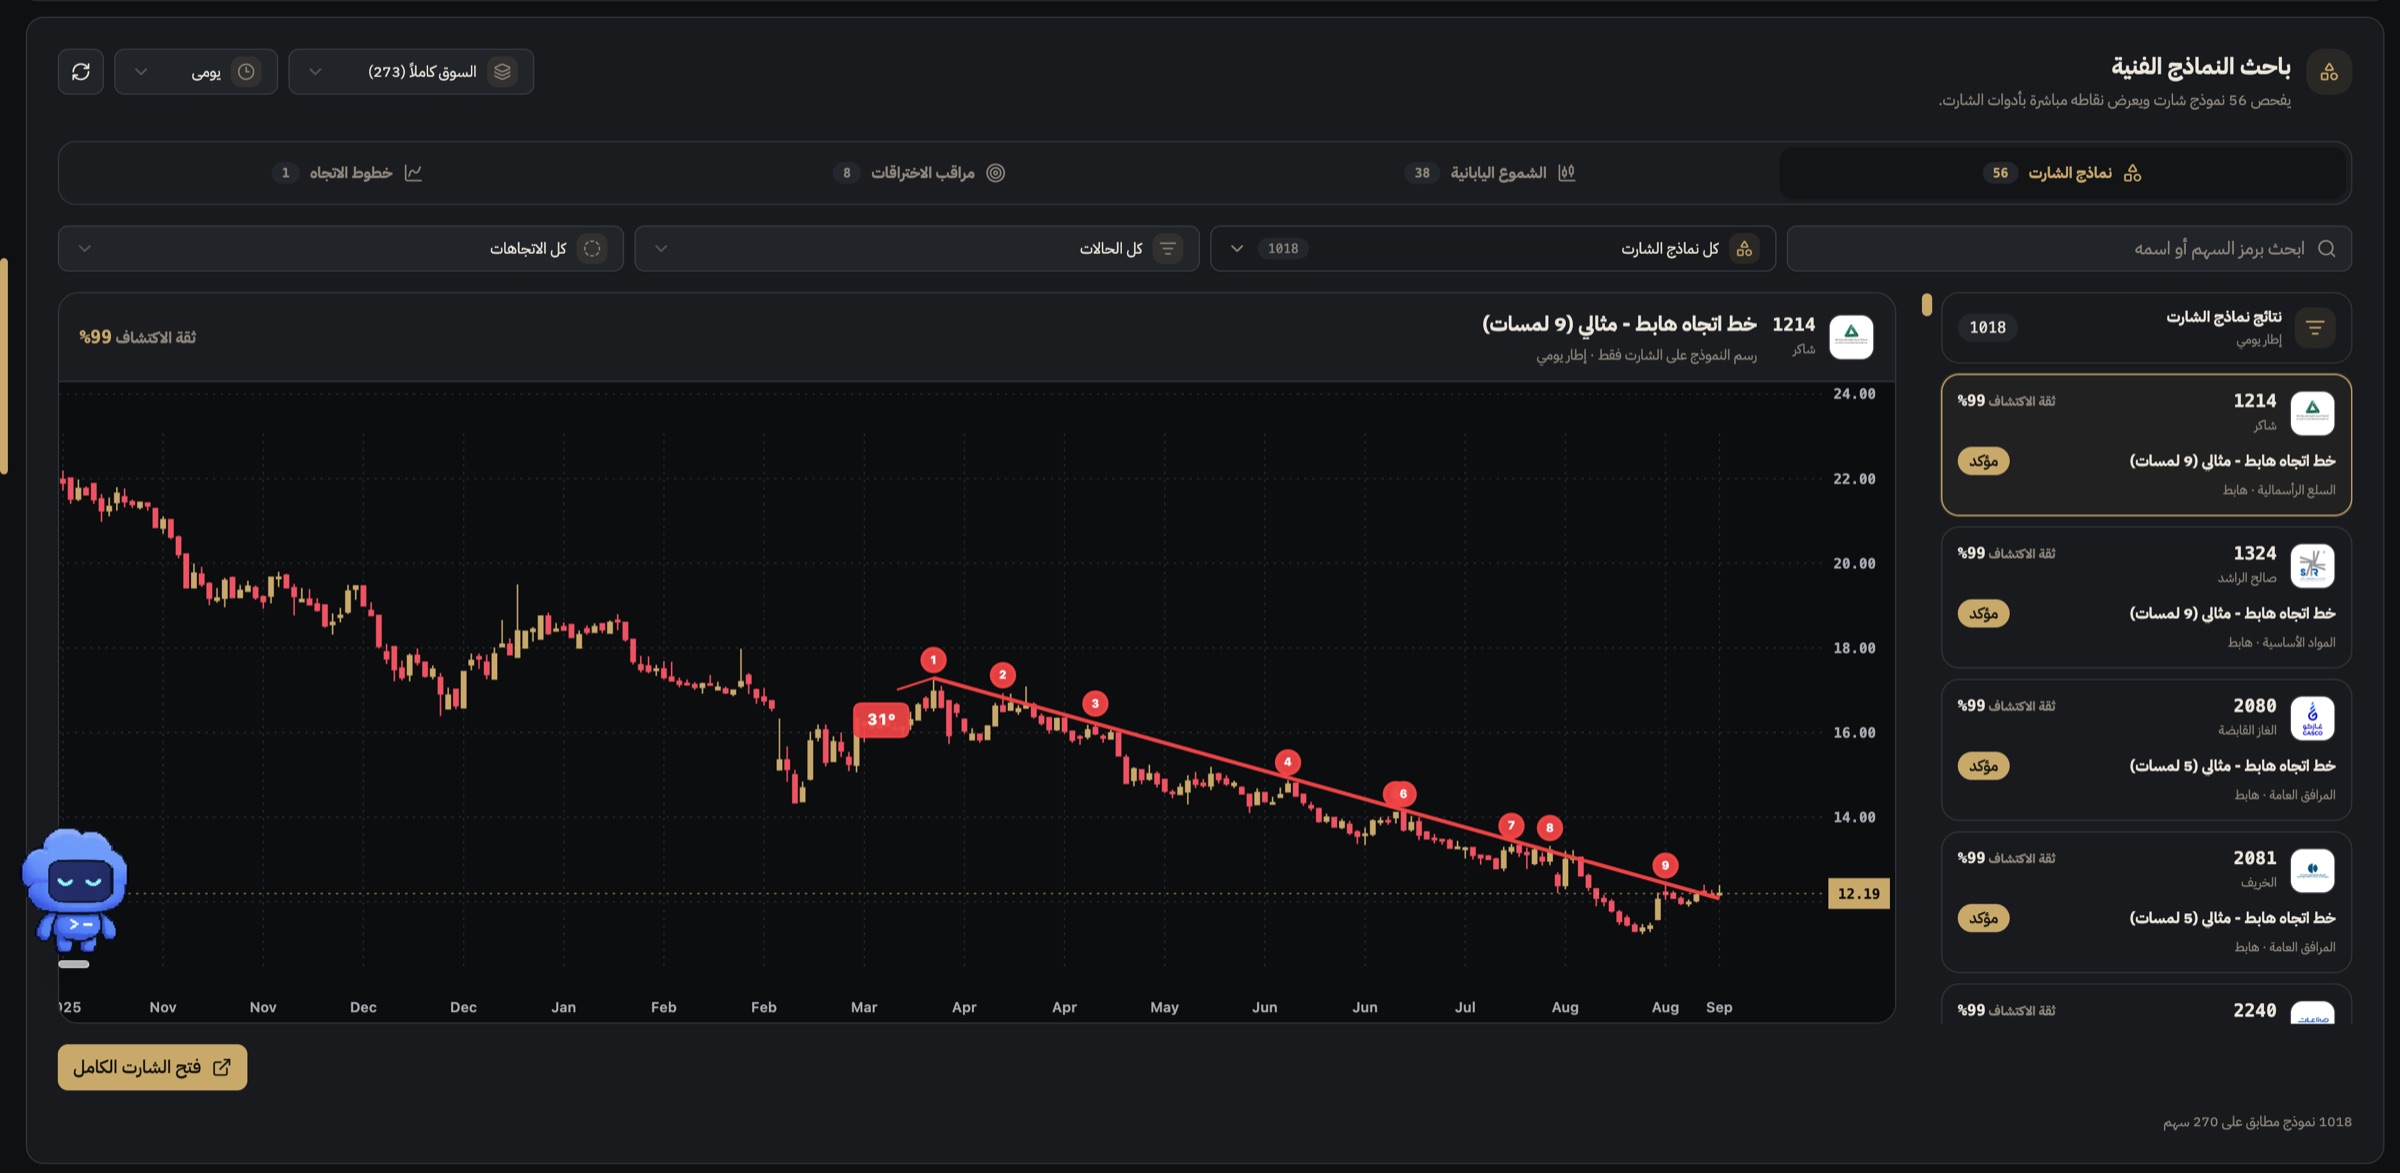
03 — Unusual activity
Unusual volume doesn't pass unnoticed.
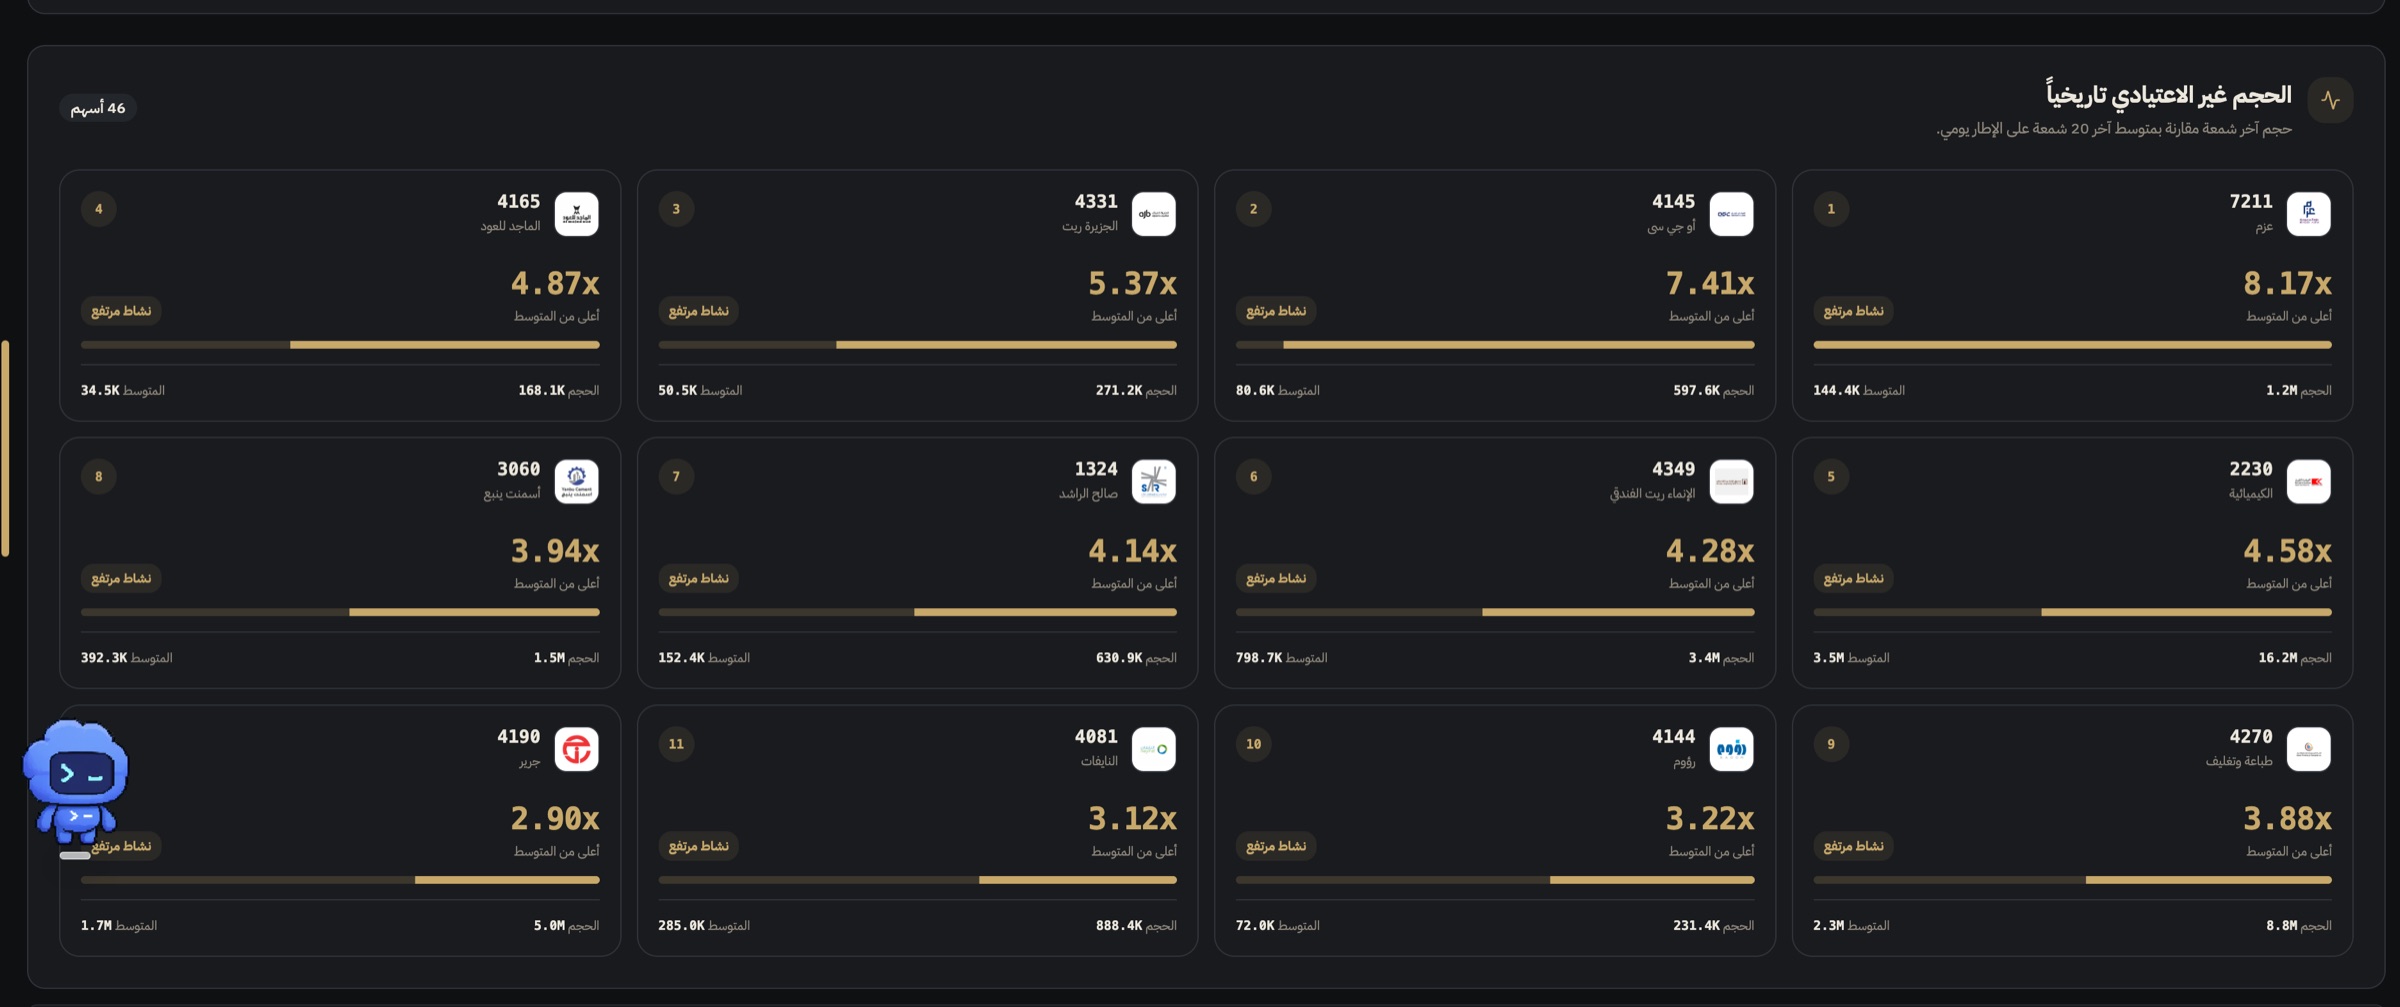
Compare the latest candle with its historical average, rank equities by activity strength, and isolate moves that deserve investigation.
- Instant historical-average comparison
- Clear ranking by activity strength
- Direct movement from signal to equity
04 — Charts
A chart is a thinking space—not just a picture of price.
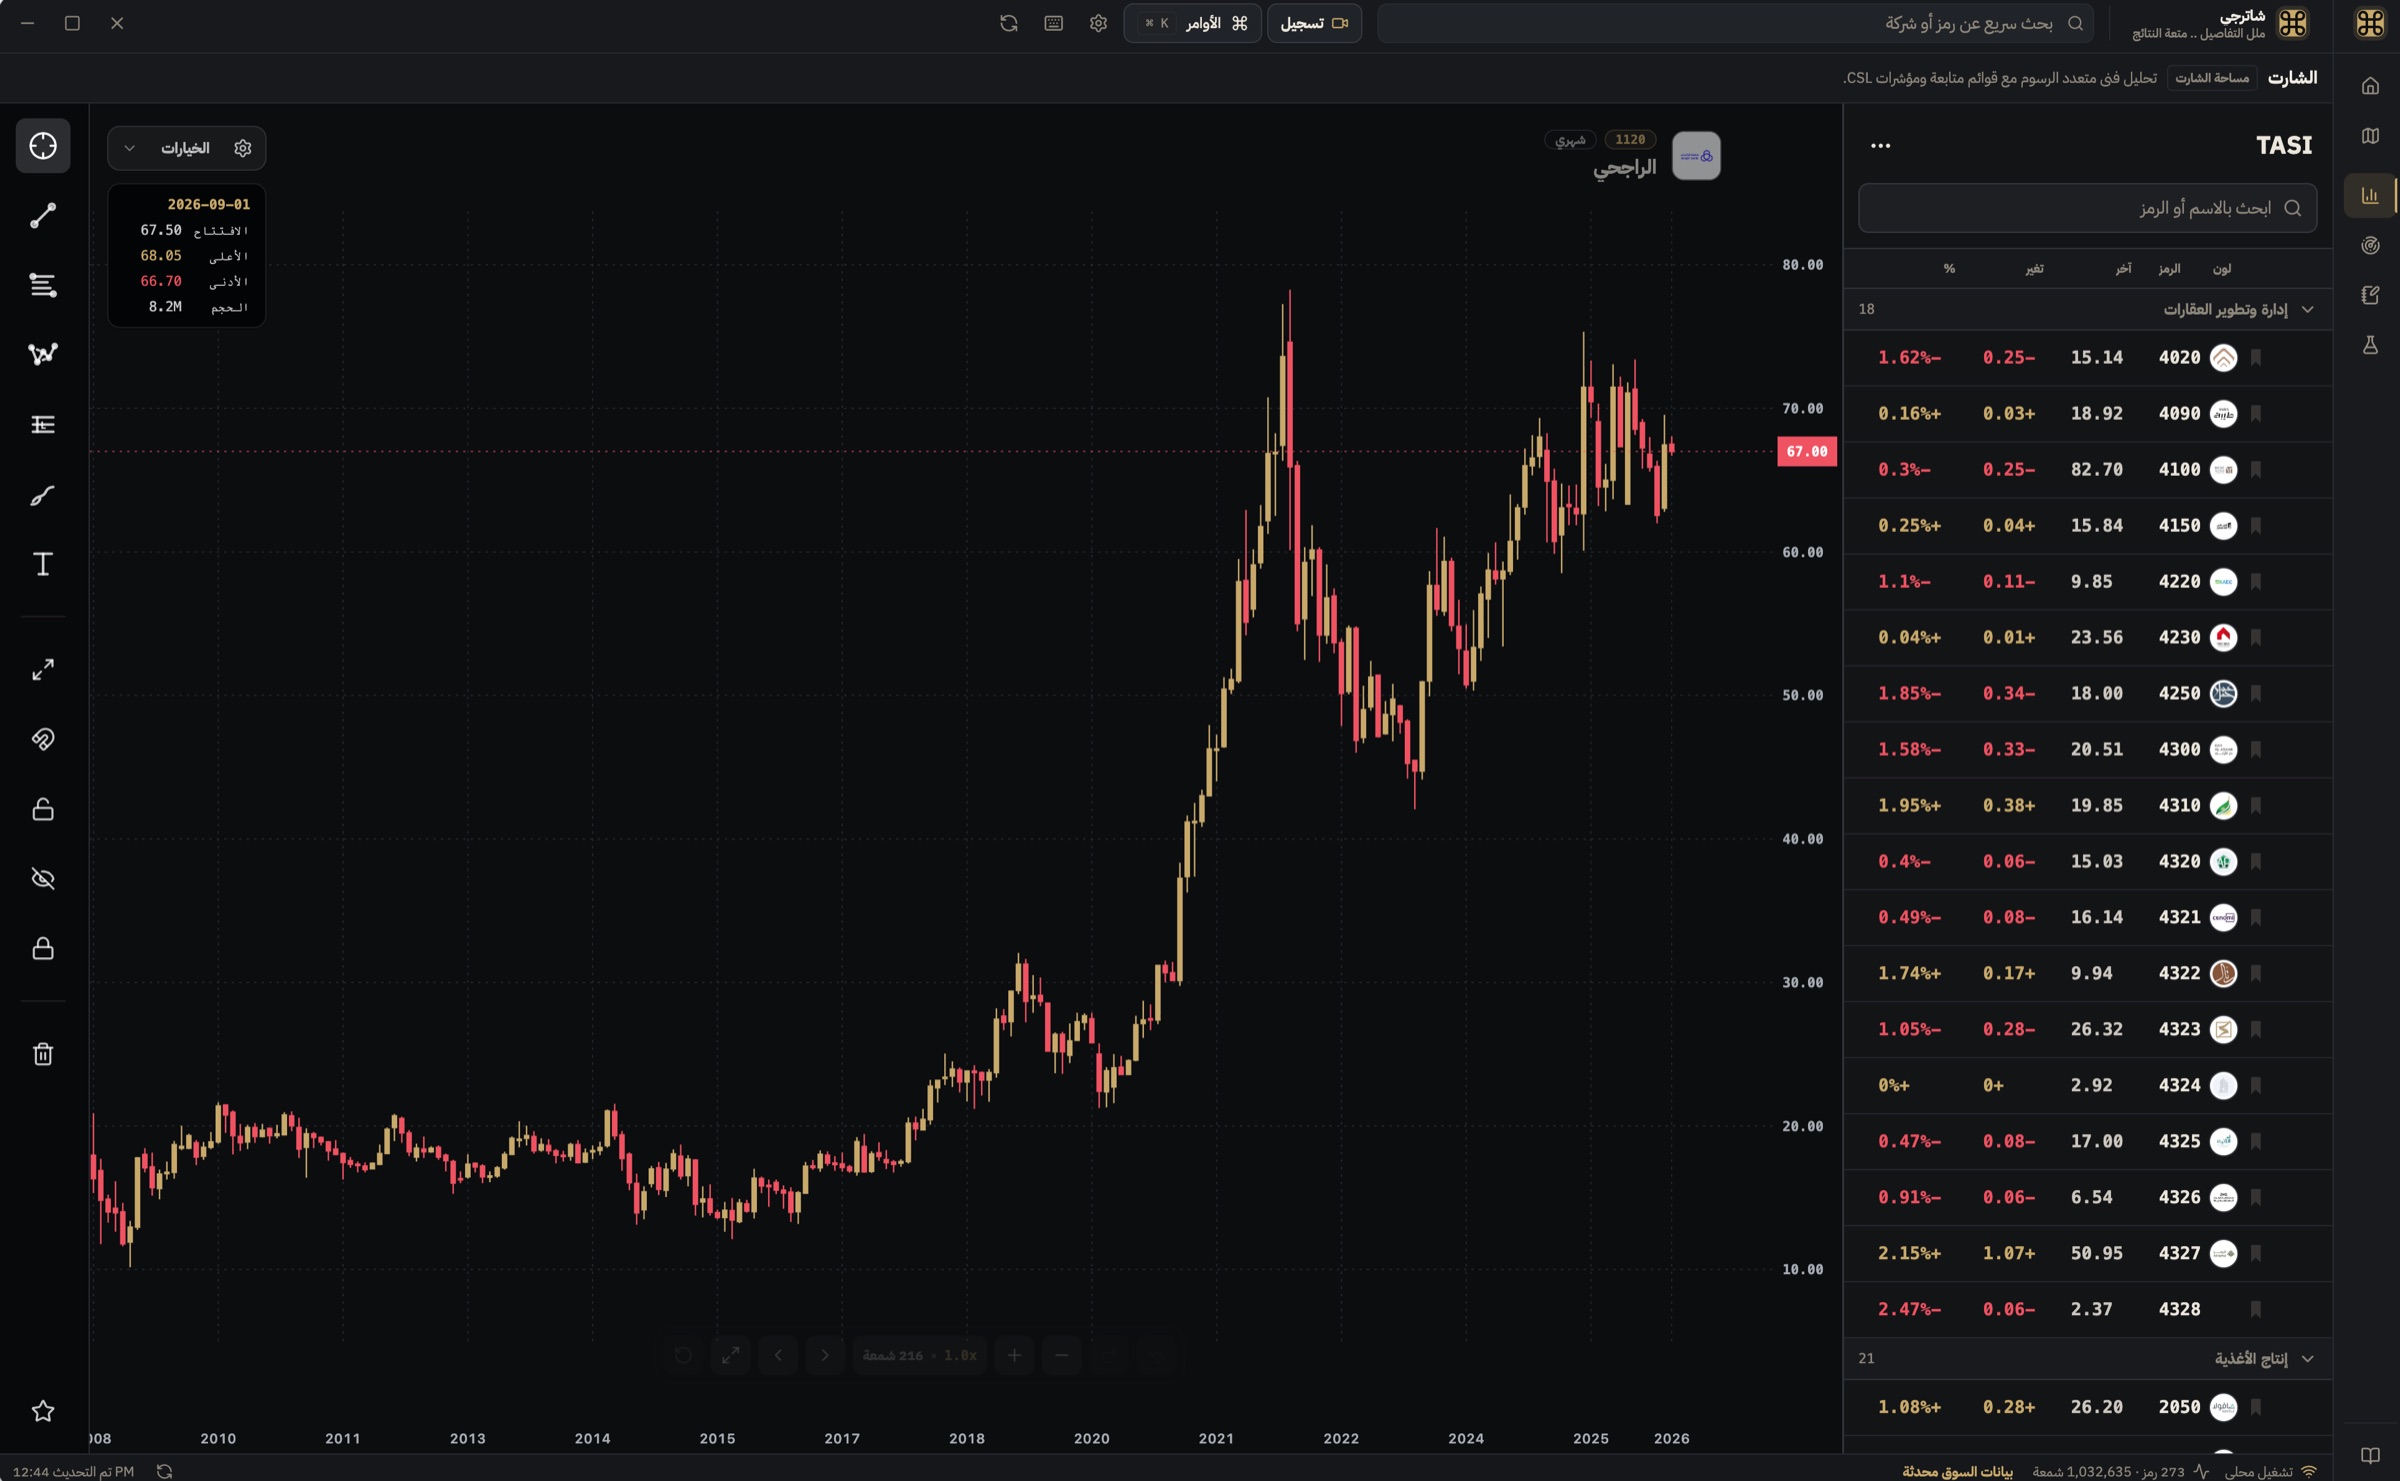
Multiple charts, watchlists, drawing tools, CSL indicators, synchronized panels and candle-by-candle Replay. Every workspace remembers your layout and analysis.
- Multiple synchronized layouts
- Watchlists shaped around your process
- Replay for practice and review
- Saved drawings and templates
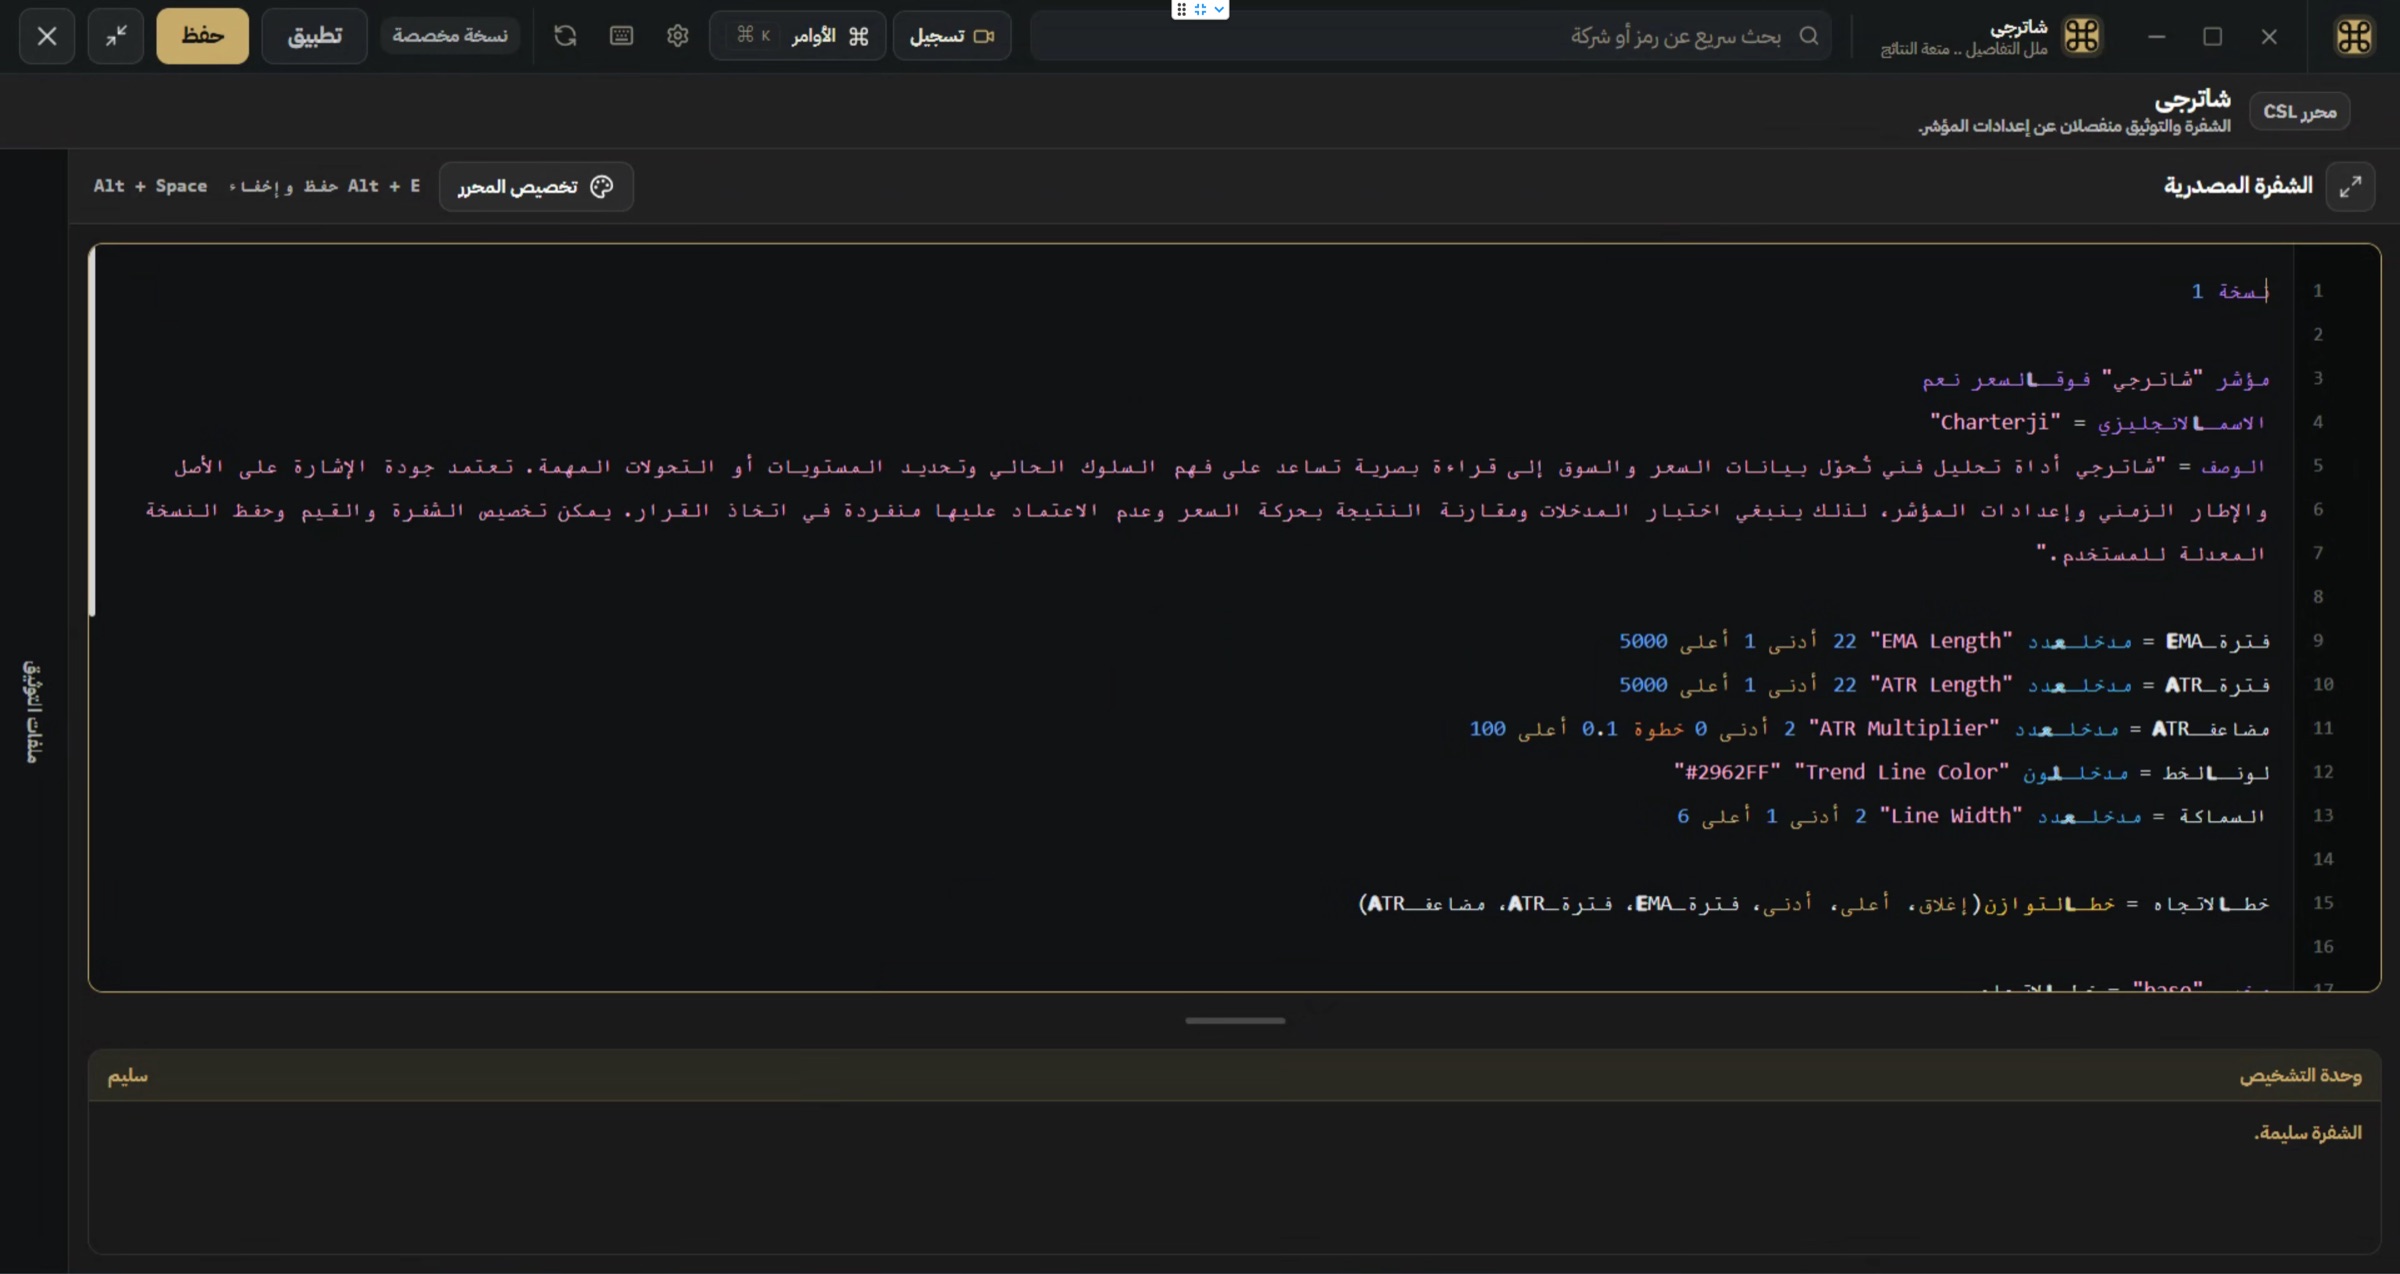
05 — CSL
Turn an idea into a tool of your own.
Create indicators and strategies in an Arabic-first market language, with diagnostics, customizable inputs and an optional AI assistant for building and reviewing code.
06 — Market Observatory
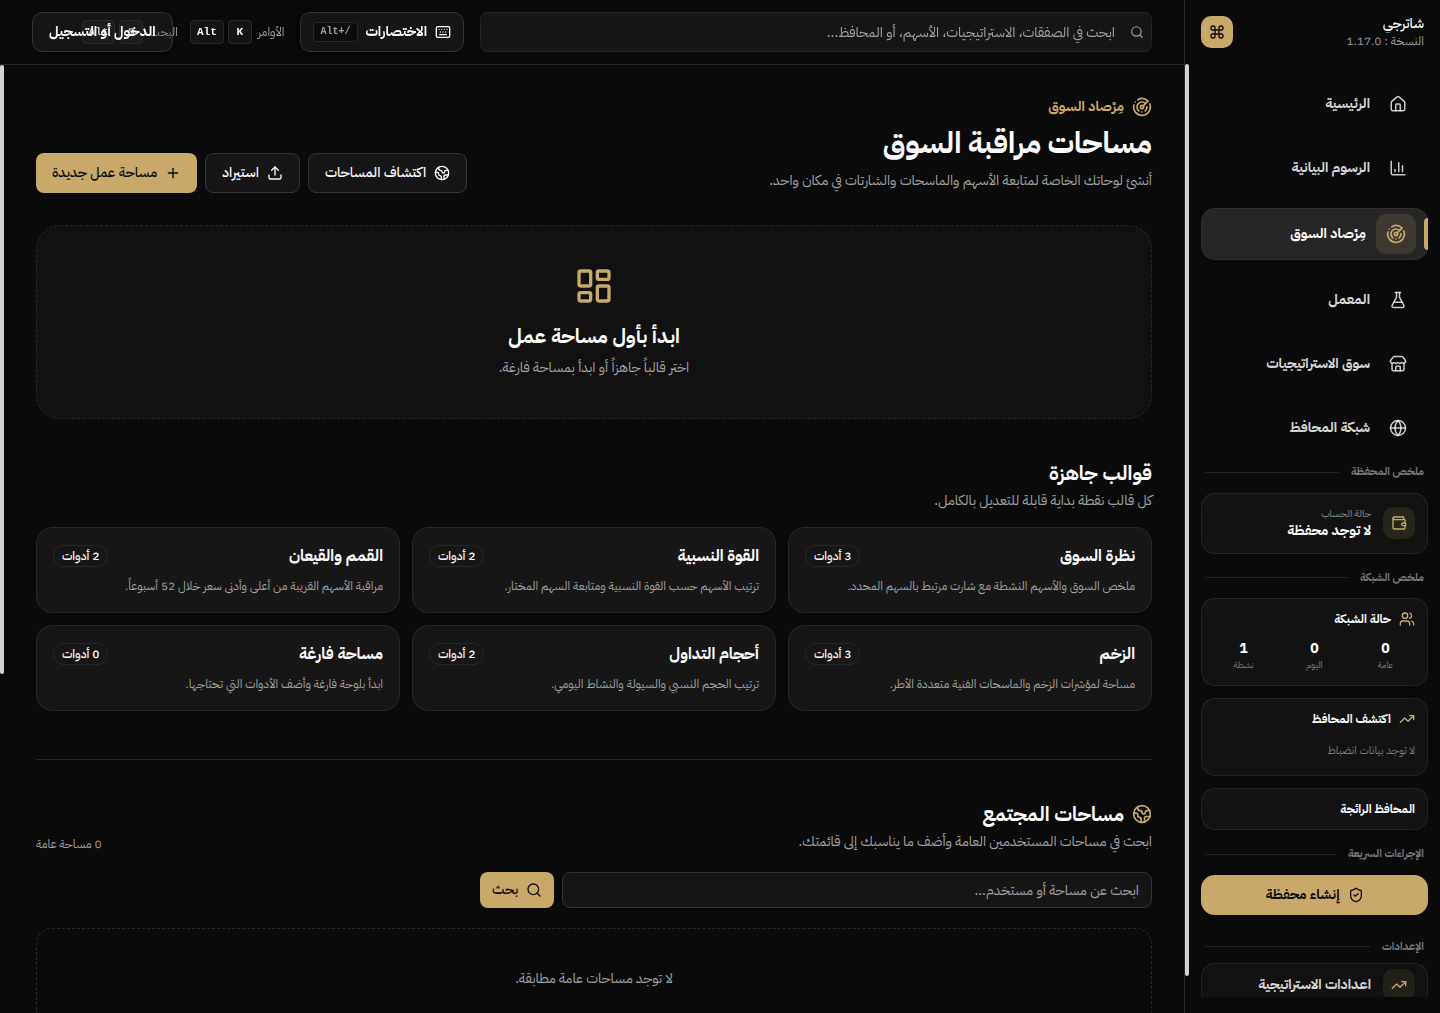
Design the market screen around how you think.
Start from a template or an empty workspace. Combine tables, scanners, charts, breadth, numerical results and notes, then connect them through the selected symbol.
- 8 widget types
- Custom columns and CSL outputs
- Compound visual conditions
- Exportable workspaces
07 — Strategy Lab
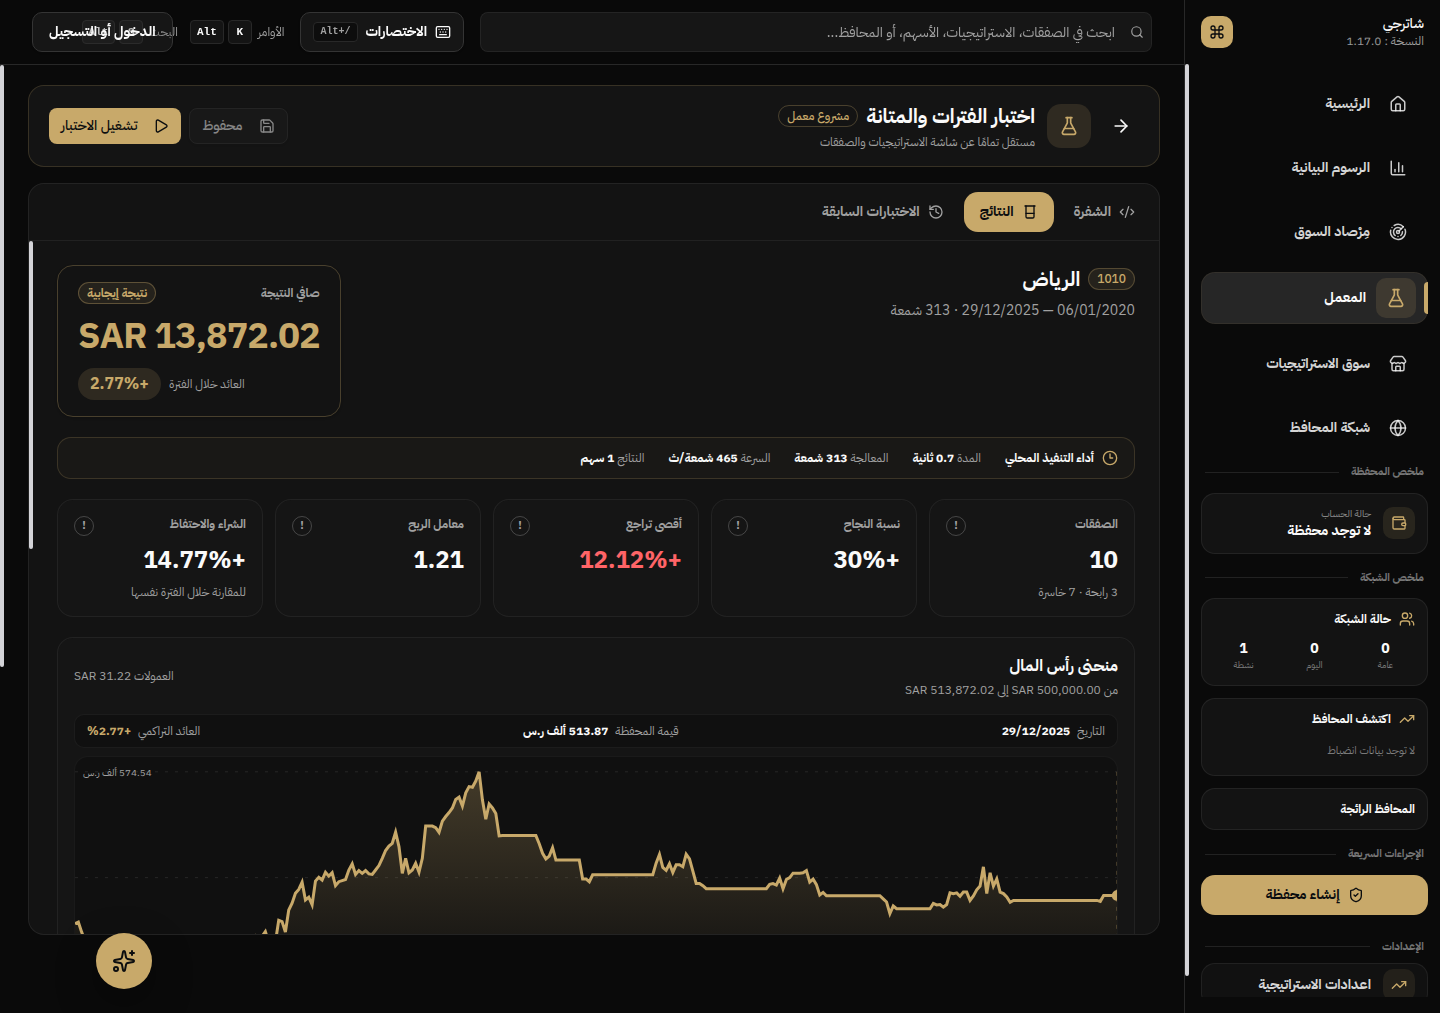
A good idea deserves a hard test.
Test one equity, a sector or the whole market. Separate development from validation, inspect the equity curve, robustness and data quality, then review every trade and order.
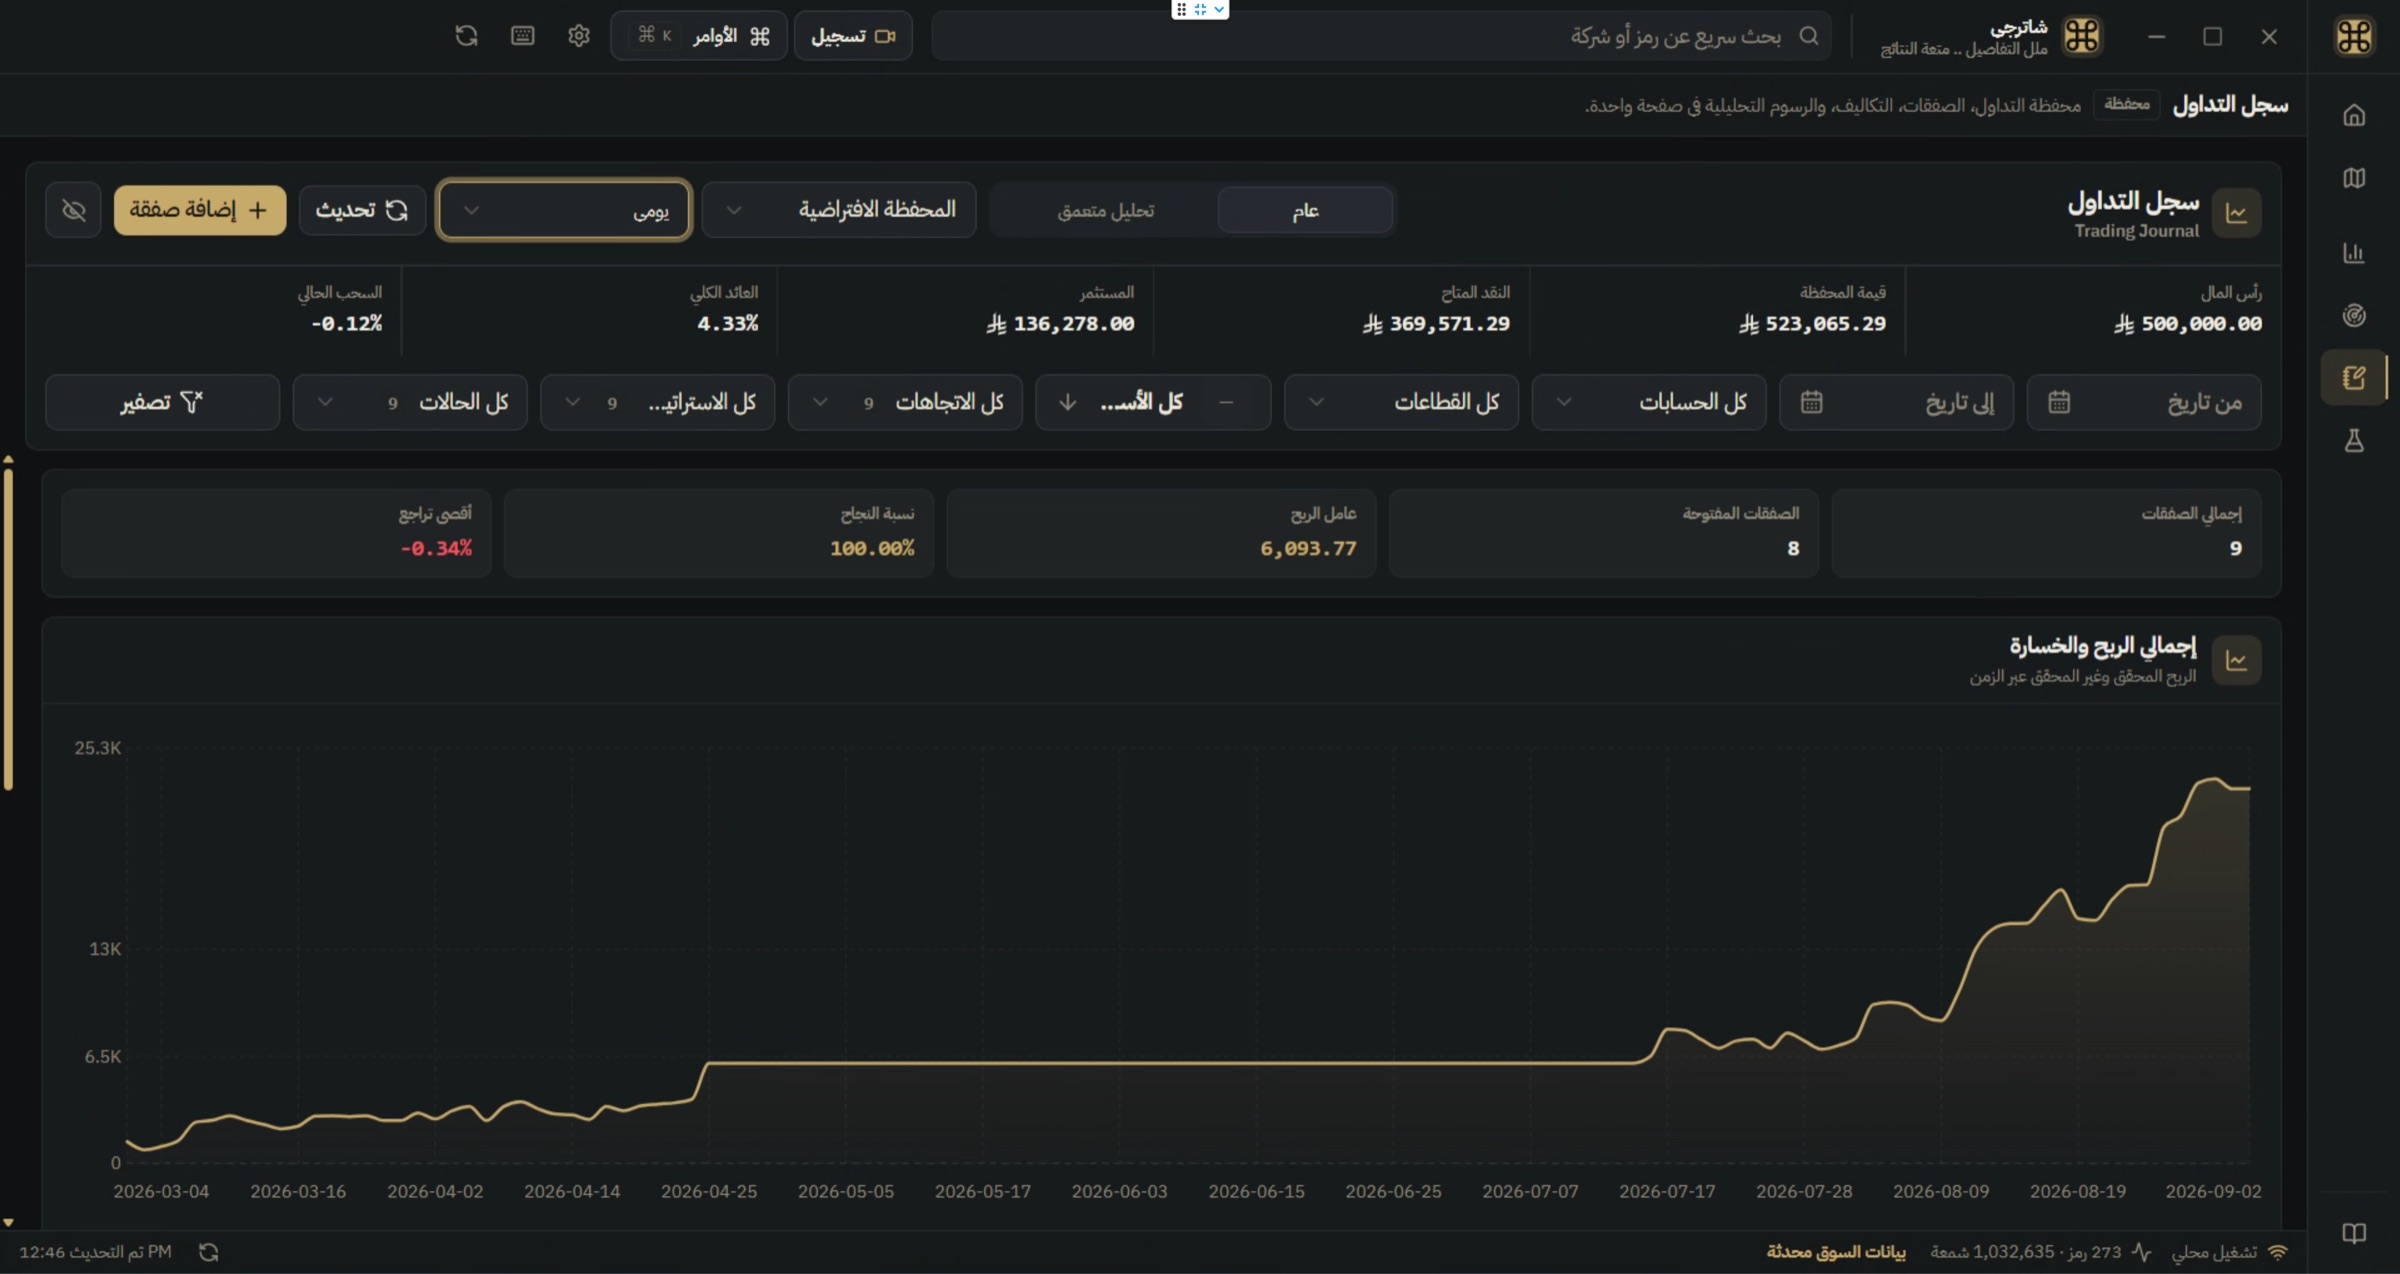
08 — Trading Journal
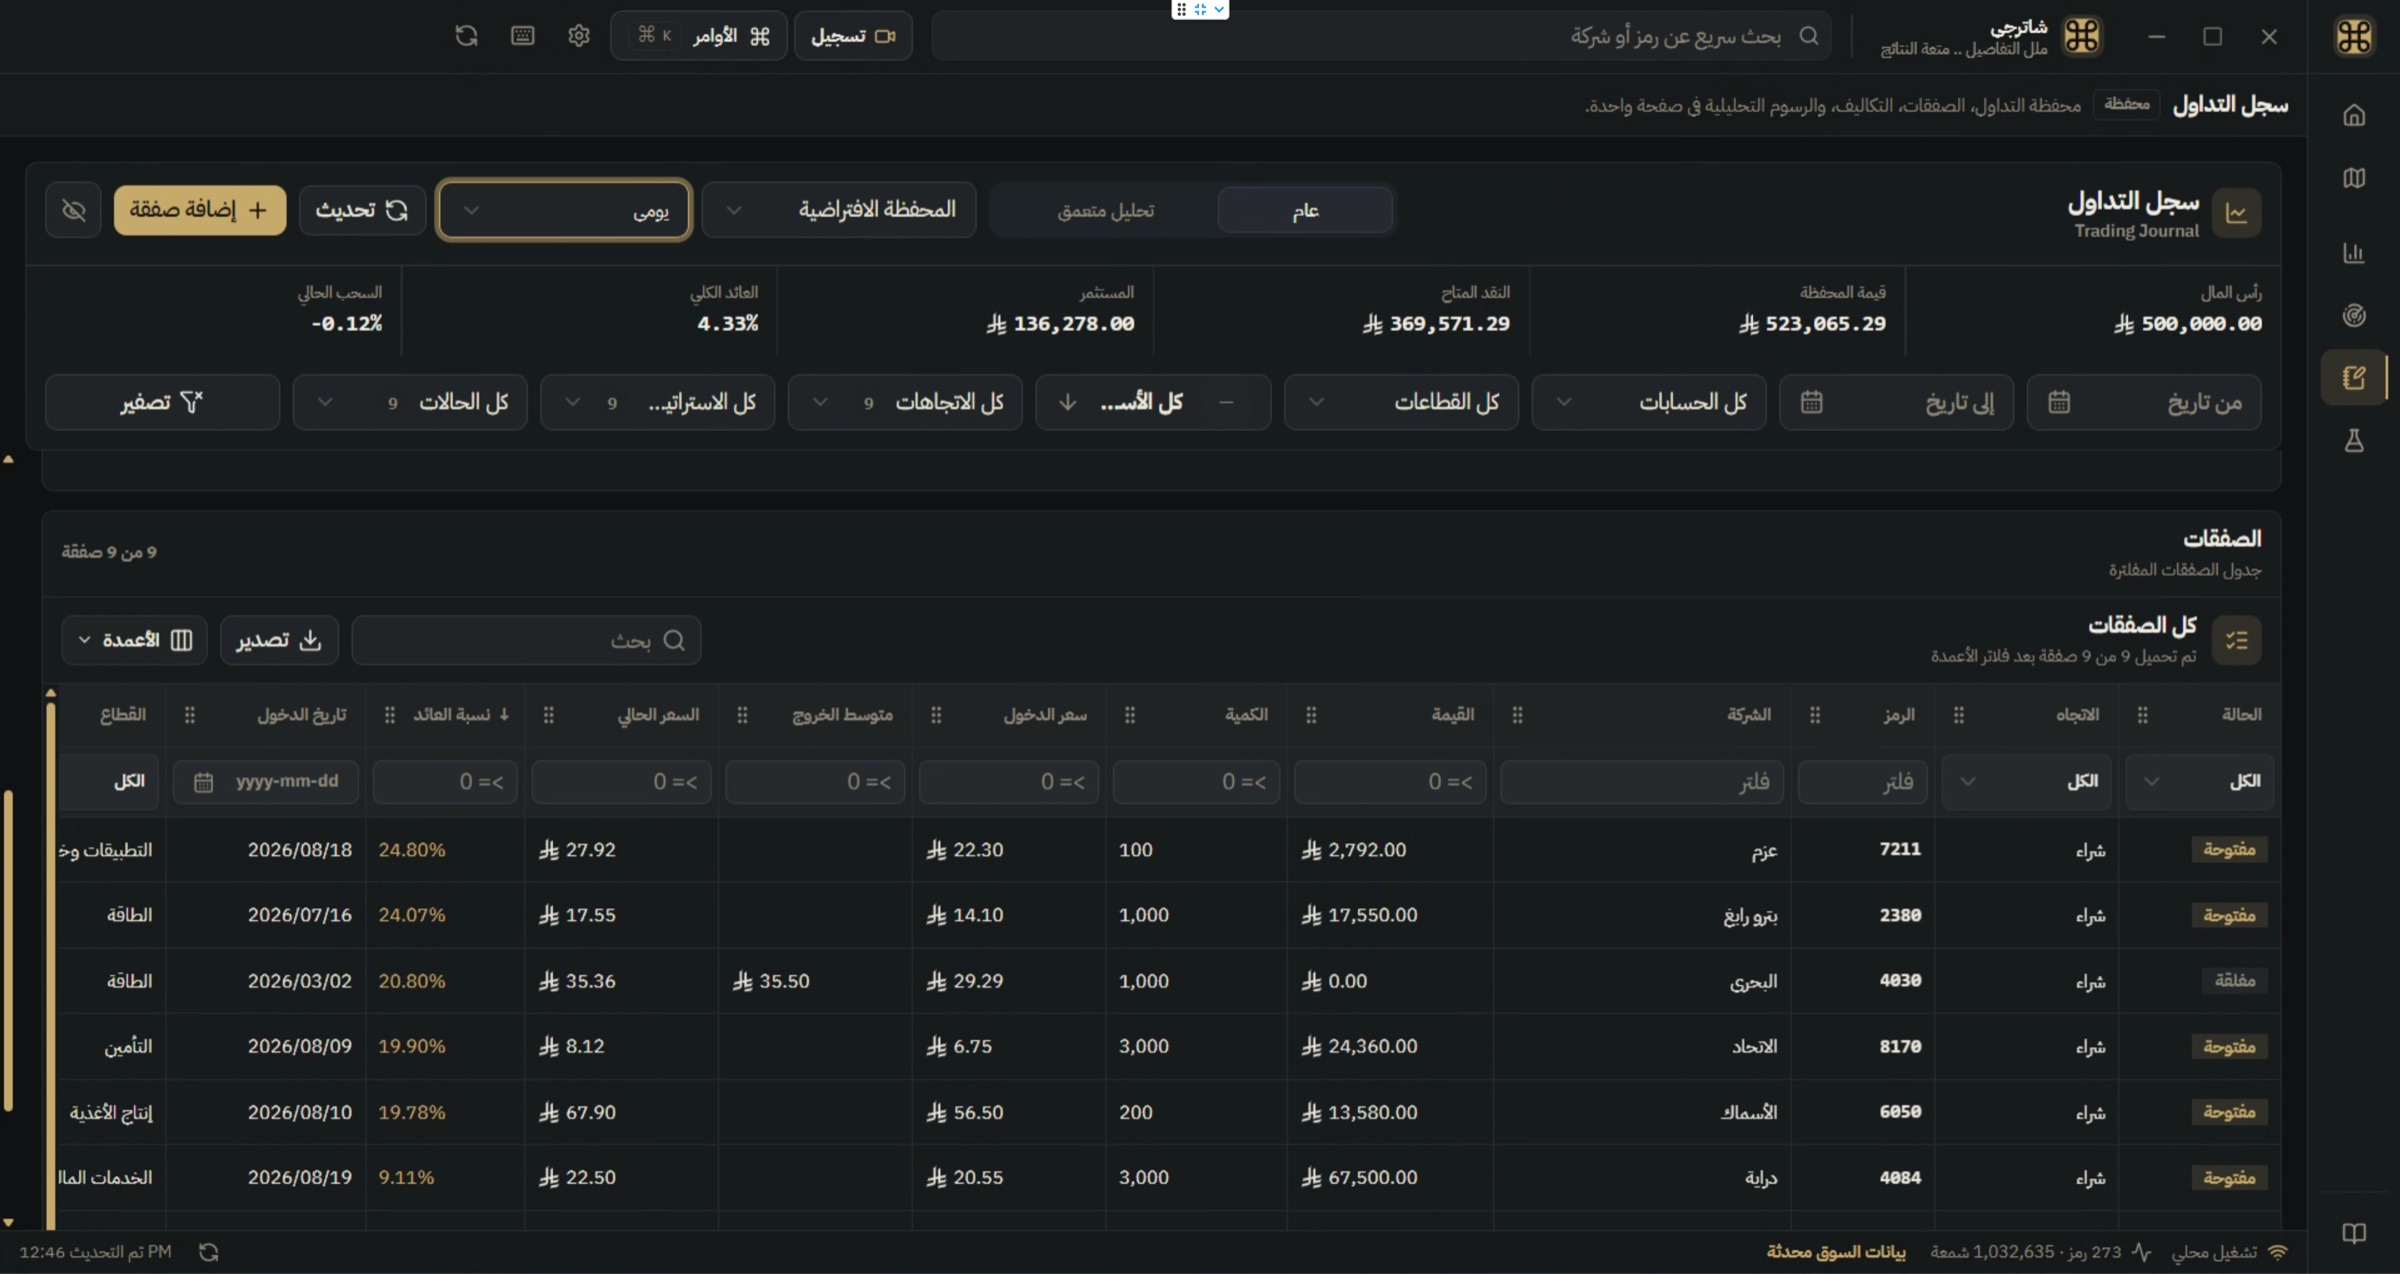
Every trade ends. Its lesson shouldn't.
Record entries, exits, costs, context and charts. Track realized and unrealized performance and turn the trade log into metrics that expose consistency and discipline over time.
09 — Recording Studio
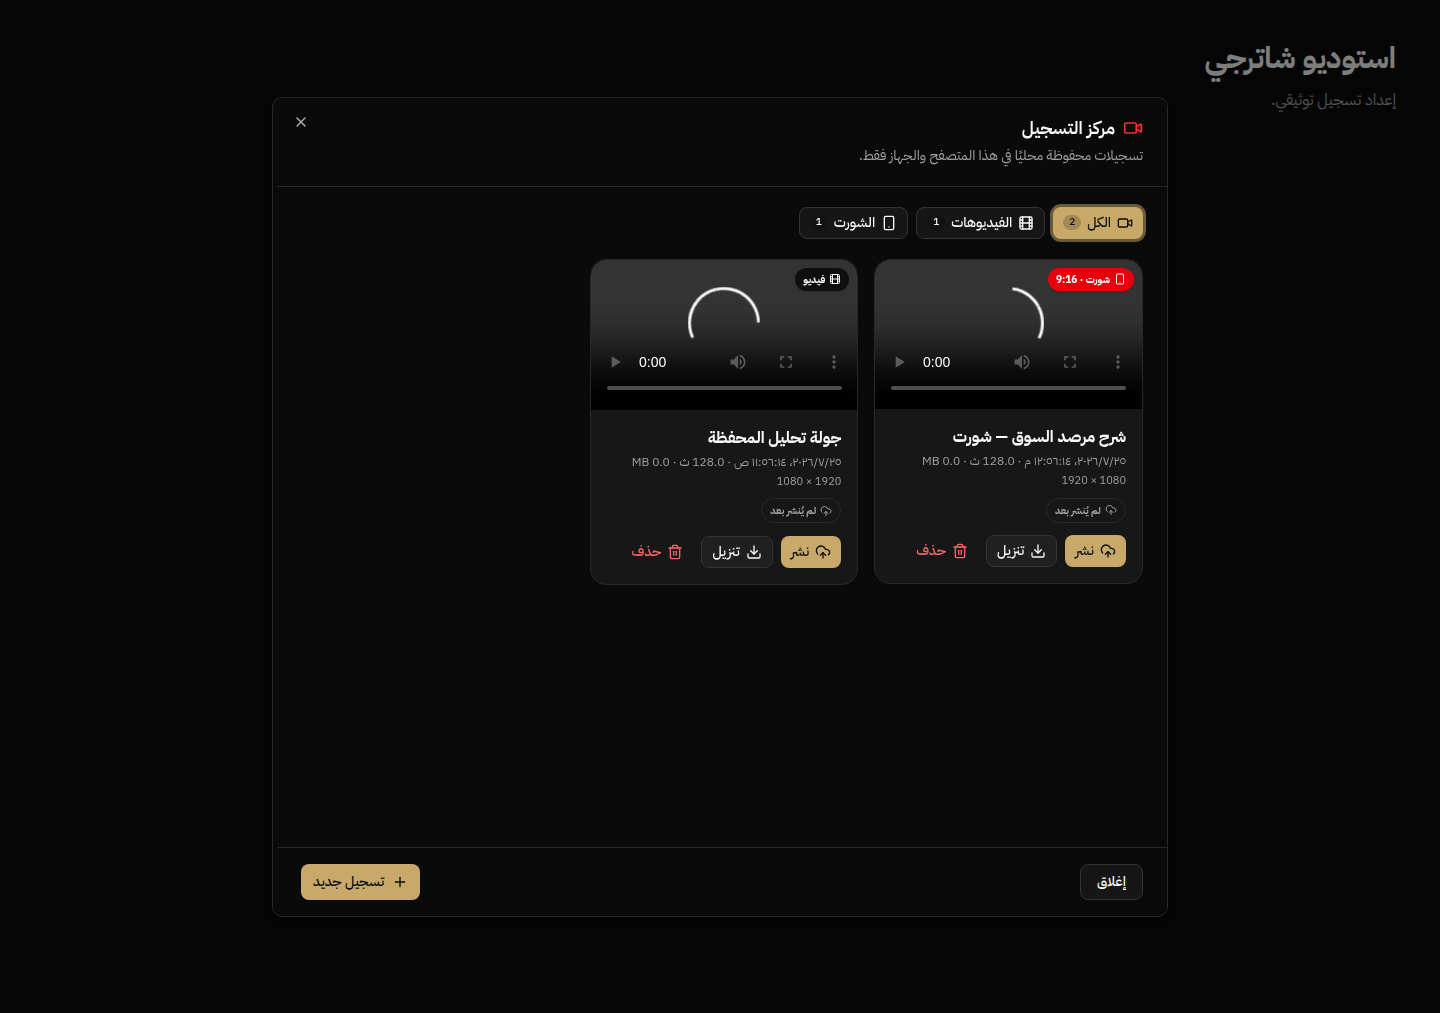
Explain your analysis. Document your process.
Record Charterji in standard or vertical video, with optional camera, microphone, cursor and privacy controls. Recordings stay in your local library until you export or delete them.
Small details that make the work faster.
A database location you choose
Saved workspaces and drawings
An interface and language built for the market

Local by design
Your data stays close to you.
Workspaces, drawings and journal entries are stored locally. You choose where your database lives, including a synced folder.
Learn about privacy←
One workspace. The whole market.
Coming soon to the Mac App Store.
Download details